Microsoft Azure DevOps is designed to support all phases of software development projects. Business leaders need insights into the work being managed in DevOps, and the Stratada report pack can fill that need.
Azure DevOps report pack Overview
Because of its great flexibility, DevOps is now being used as an agile work management system for many kinds of projects – not just software. The Stratada Program Taskboard and Timeline visuals are the highlights of these reports, but many more metrics are analyzed with other types of visuals.
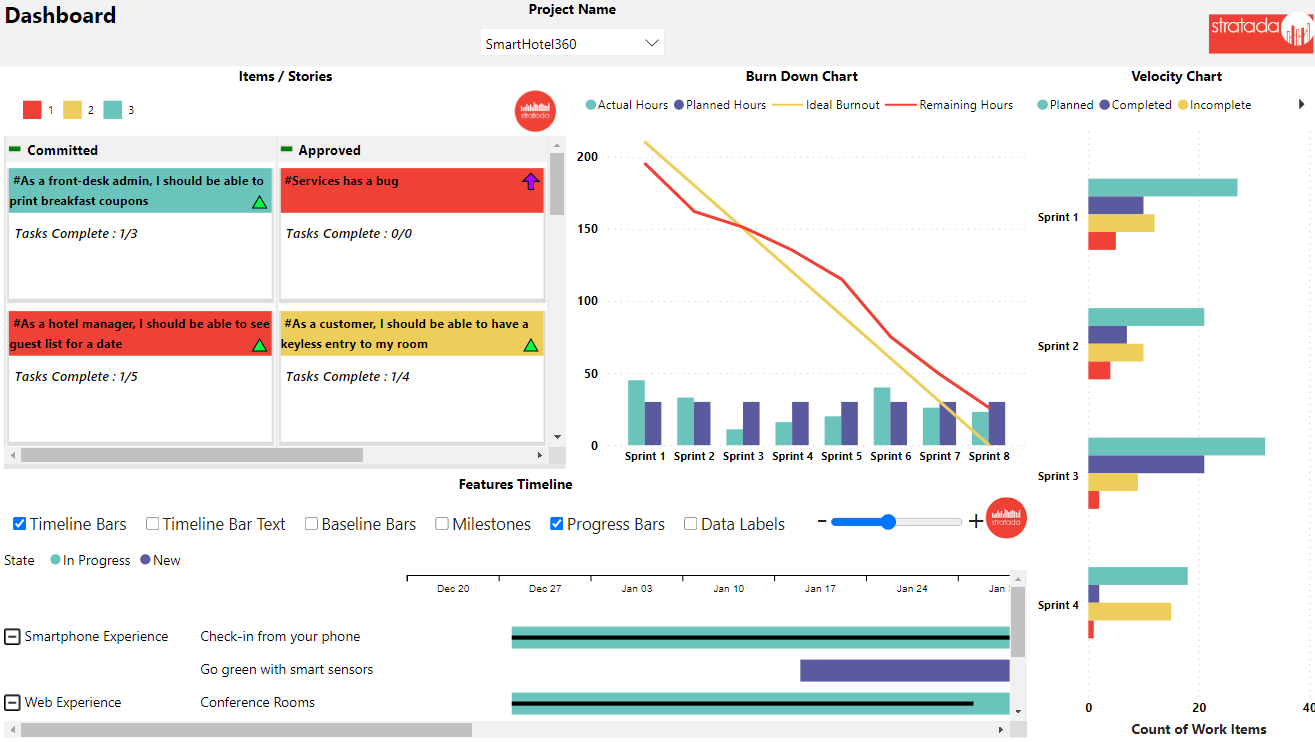
Azure DevOps Dashboard
The dashboard report for Azure DevOps enables high-level insight into the various work metrics managed. This view is useful for senior leaders, stakeholders and managers. Drill through from this view to see more details like the reports below.

Stratada Timeline
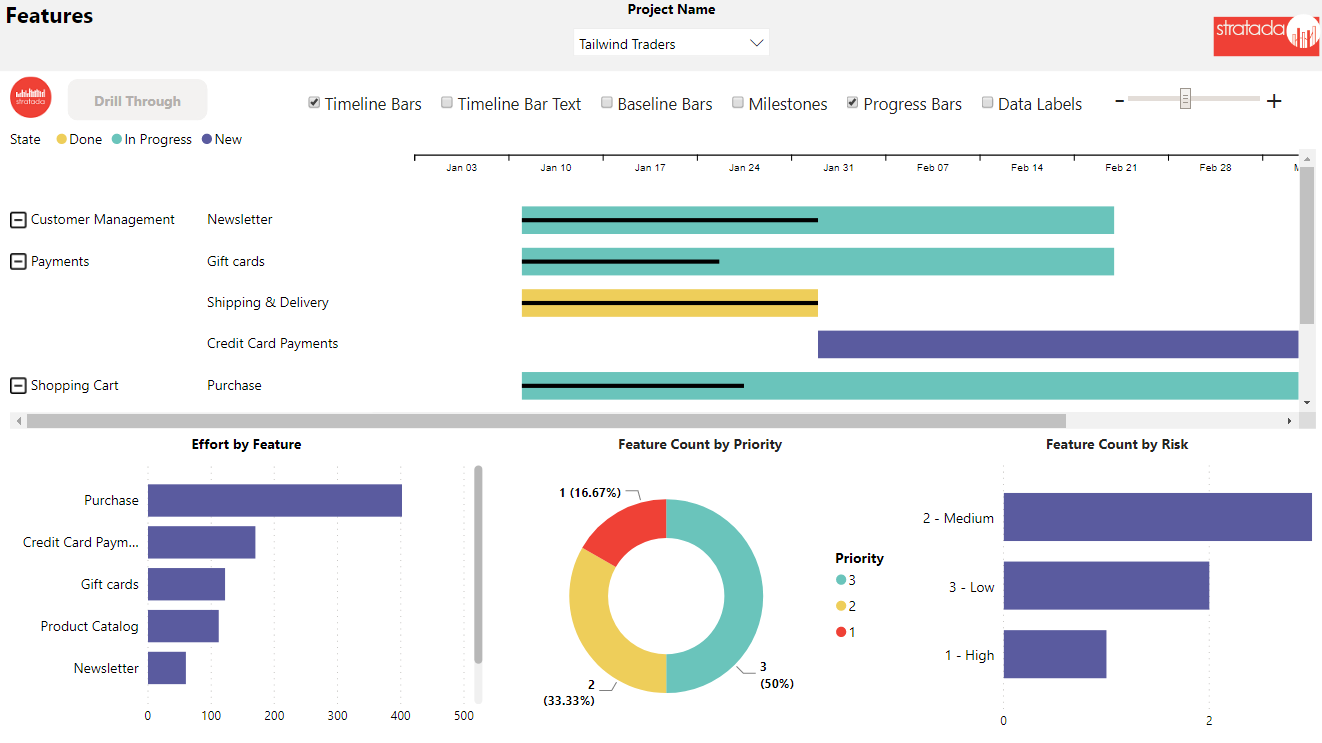
The Stratada Timeline visual can be configured to show work items at the feature level, and then drill through to see the underlying items or stories.
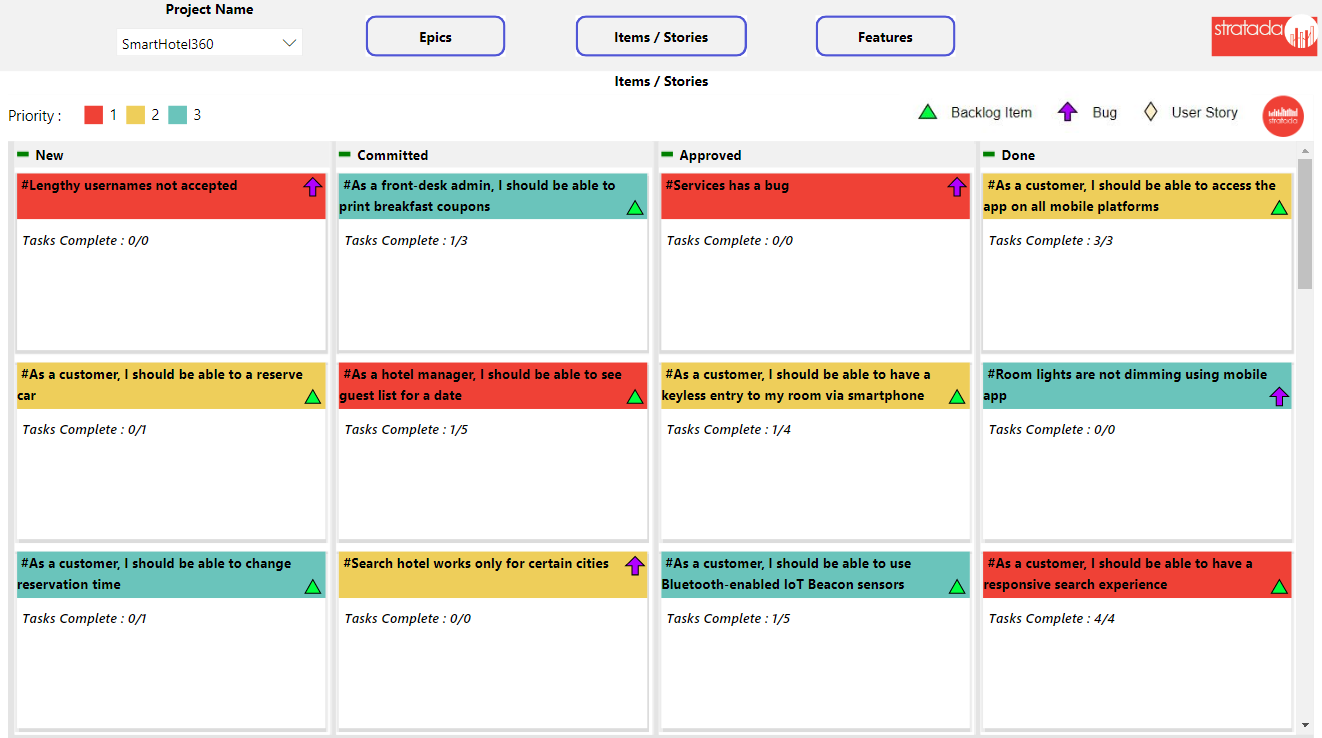
Stratada Taskboard
Look at the task details within one or many projects, sprints or even stories. Categorize cards by color and by icons. Add up to three different text fields in the card body. Create a few or many buckets, and drag-and-drop to change the bucket order.
features
The Features report shows Timeline with progress by categorized feature, plus metrics like effort, priority and risk. Drill through from this report to a specific feature for more details.
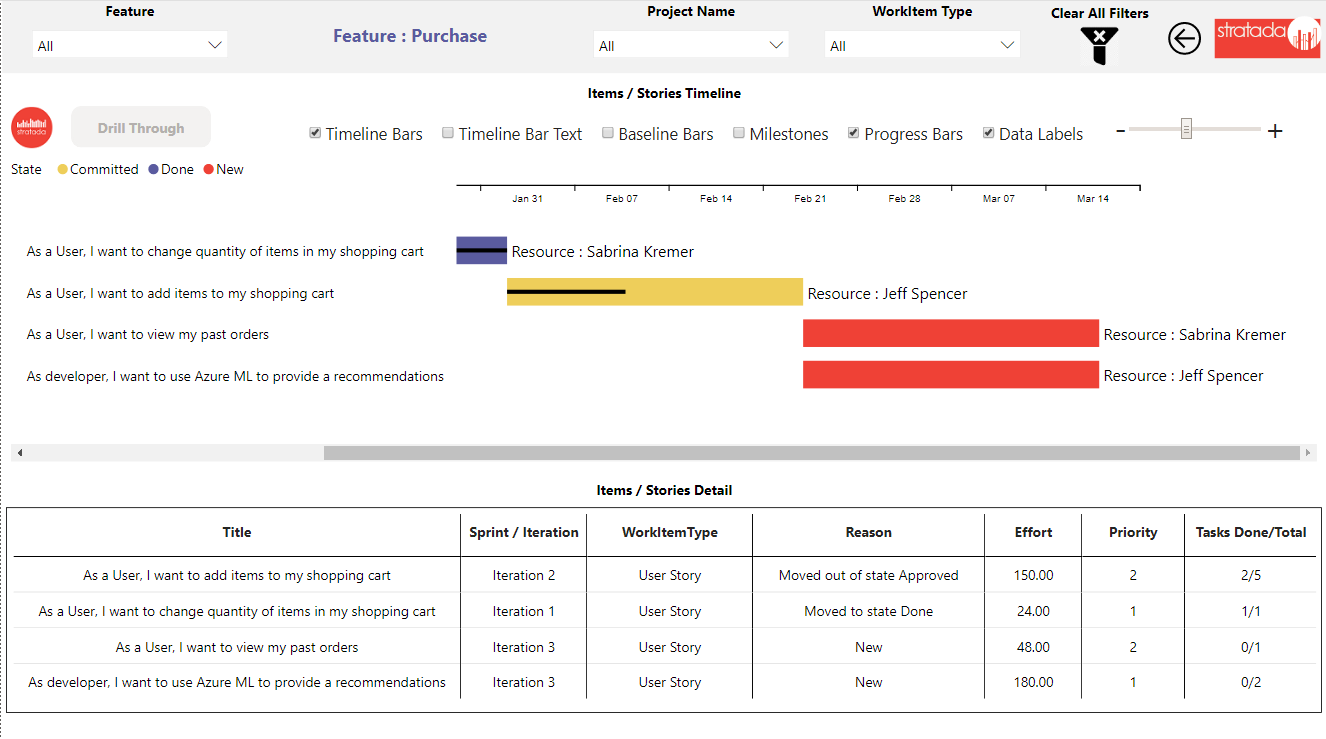
Items and Stories
Within a specific feature, see details about user stores and items including a Timeline and tabular data.
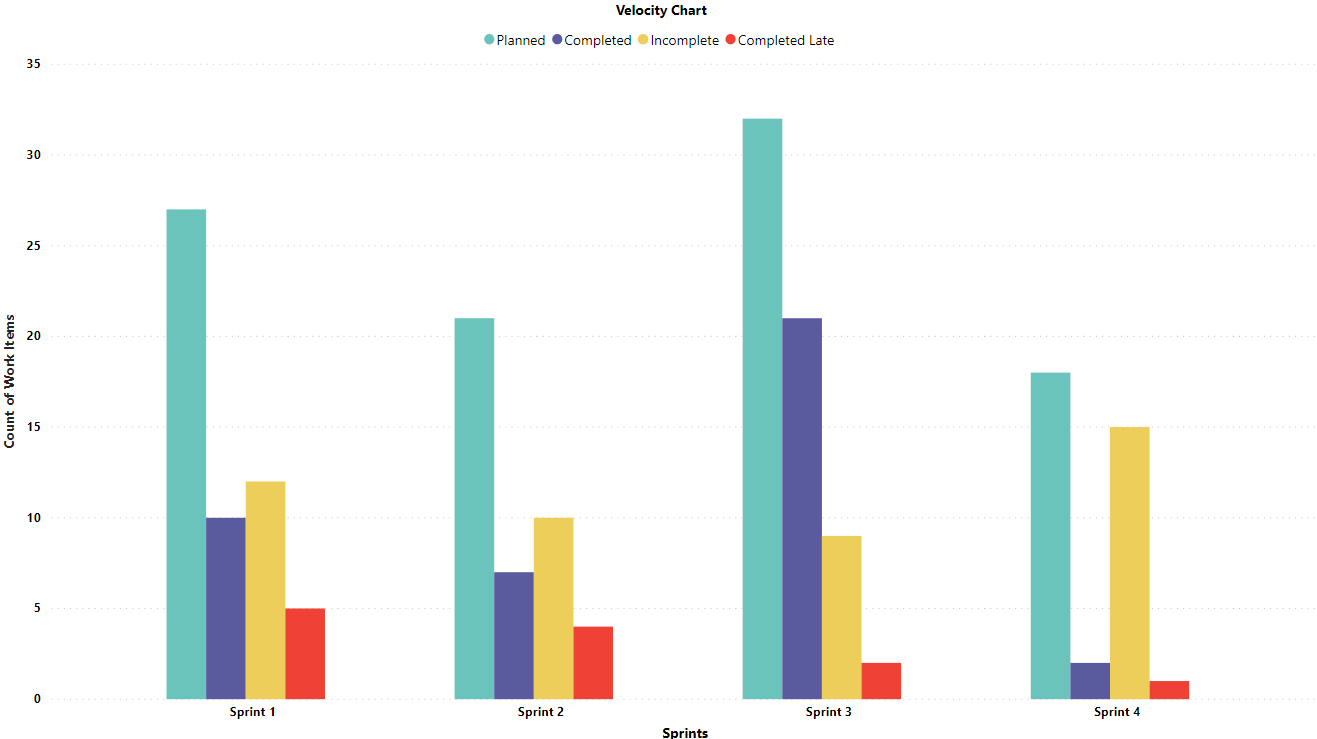
Velocity Chart
The velocity chart provides an overview of how much work has been delivered for each sprint. This is one of the best ways to understand the velocity of work flow for an agile team.
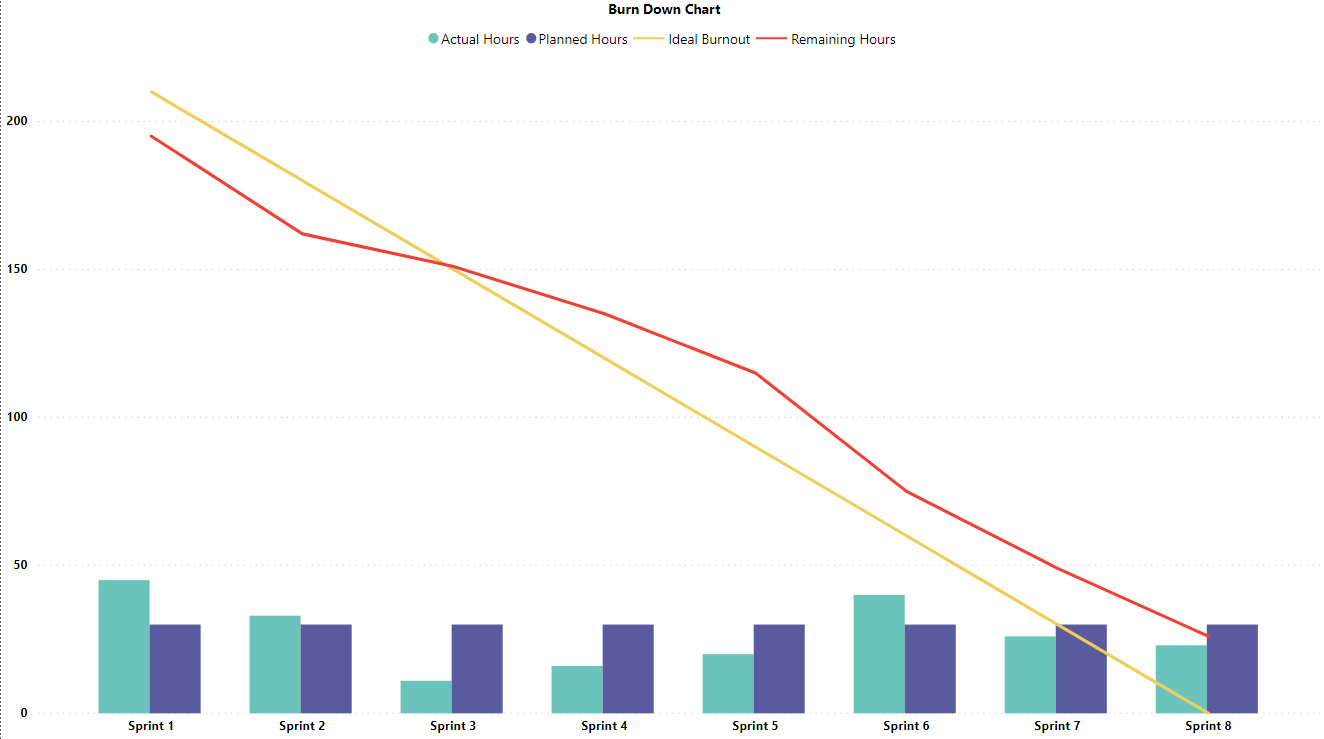
Burn down chart
The burn down chart shows remaining work versus time. Remaining work can be measured using various options including number of tasks or story points. Depending on team estimating history an efficiency factor can be applied.
Developing reports and dashboards is both an art and a science. We put deep thought into our report packs so as to deliver a highly valuable product that is both insightful and elegant.
So what’s your data story? We can help you tell it.
